
🎟️Paid Members - My Wealth Dashboard

This is the Wealth Dashboard that I started building in 2009 and find it really helps with:
Seeing month to month changes across different asset classes that you hold
Watch as your allocations grow and shrink relative to each other for diversification
Inspires you with projected wealth calculations
Tracks growth over time
Real time data of the assets you hold
Dashboard
The Dashboard page starts off with a bold overview of the most important thing. Your CAGR (Compound Annual Growth Rate) and time to double.
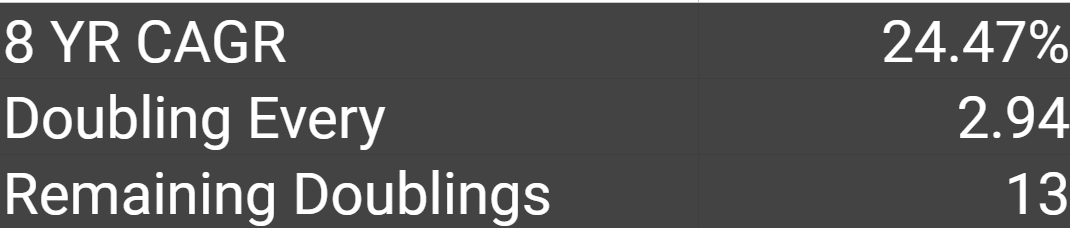
You want to aim for as high of a value as possible, as it affects your time to double.
When you plot return rates of 10%, 20%, 30%, 40%, 50% and their respective time to double your money using the rule of 72 - you get the chart below.
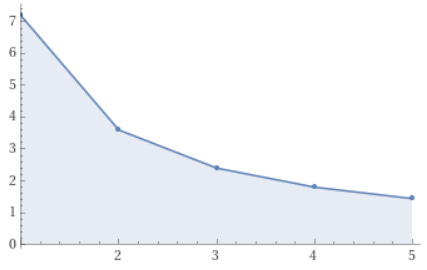
Observe the parabola where the rate of change for doubling time diminishes with increase in return. Weighing the effort to achieve a high CAGR value over multiple decades, against the risk of investments, against the parabolic nature of time to double, one may consider a sensible mid point to aim being sub 3 year doubling. Or 30%.
