
2026 Bitcoin Charts
Probably Short Term USD Price Decline

Summary - I’d probably wait a bit before buying Bitcoin in 2026.
I’m not usually one for charting, but I thought I’d have a quick look given Bitcoin’s price action of the last few months.
In this article I wrote about the upcoming (September 2025) attack against Bitcoin, which turned out to cause a large selloff.

Normally I’d refer to the stock to flow chart from Plan B, however within recent times, it appears he has put his model behind a paywall. My suspicion is that his r squared value is dropping with time therefore limits exposure to it.
Stock to flow effectively gives a statistically significant plot line for Bitcoin’s future price. Helpful for forecasting its future price.
We can do this as Bitcoin has been engineered to have a finite supply and fairly predictable production levels by time period.
Alternatives to Stock To Flow
As we are looking at alternatives - I produced some diagrams in TradingView.
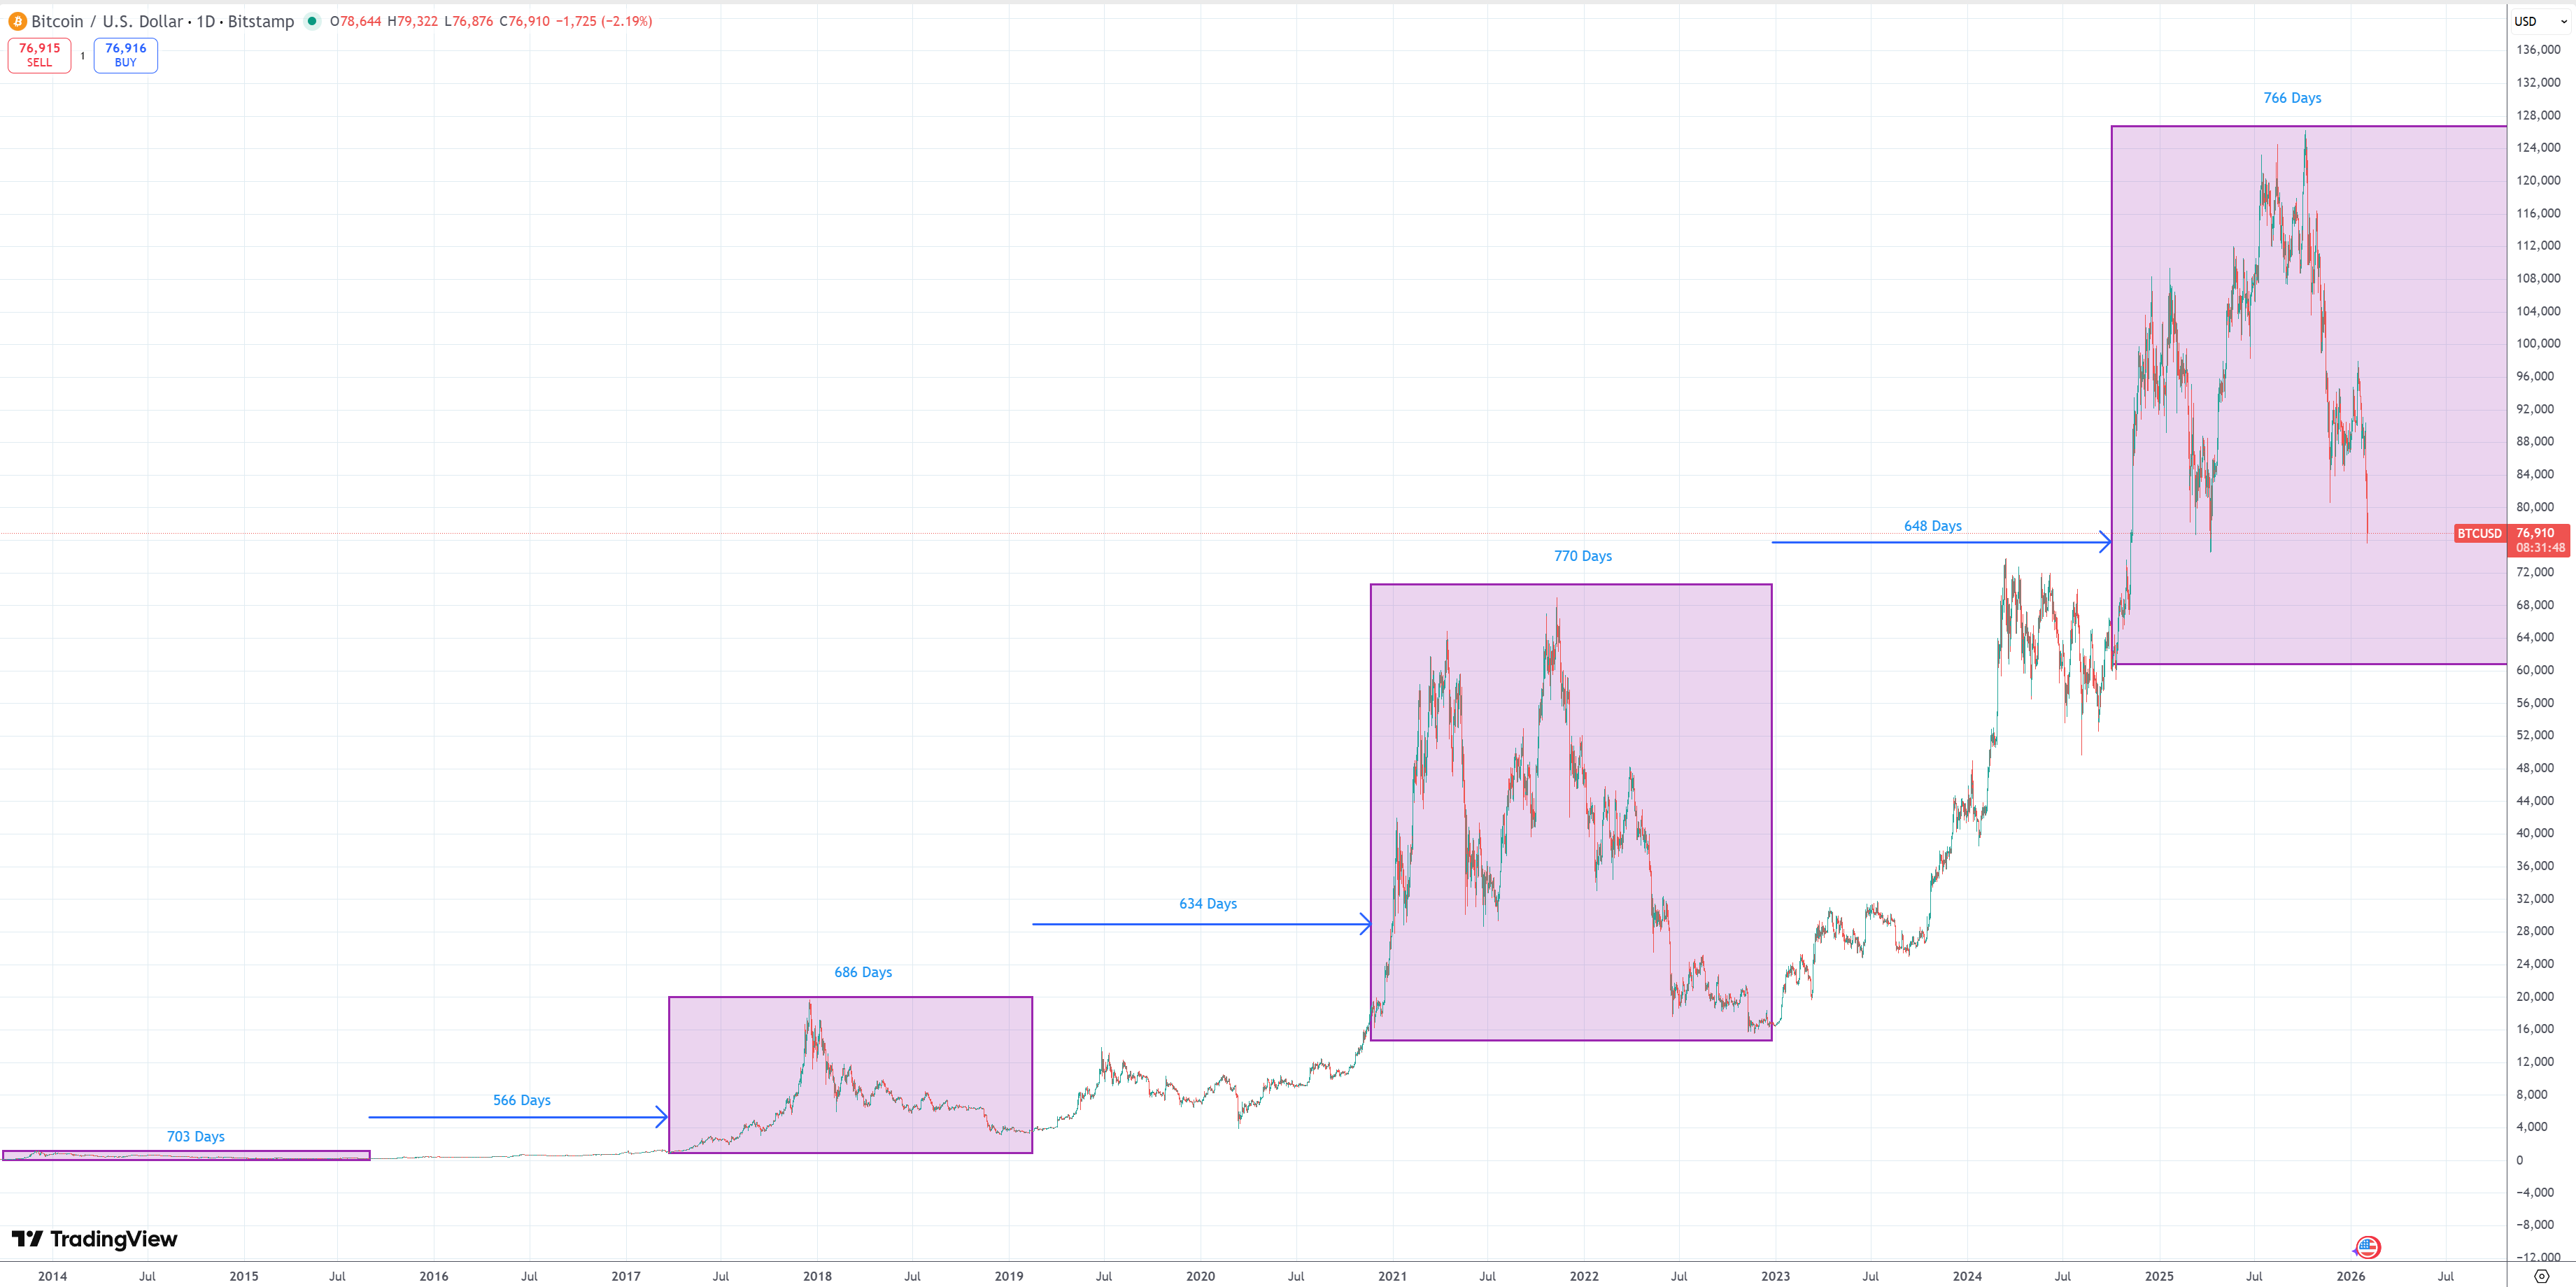
This first one shows a non-logarithmic chart which shows predictable cadence and steps. This first visualization would suggest we have a 30-40% more period of time for decreasing prices.
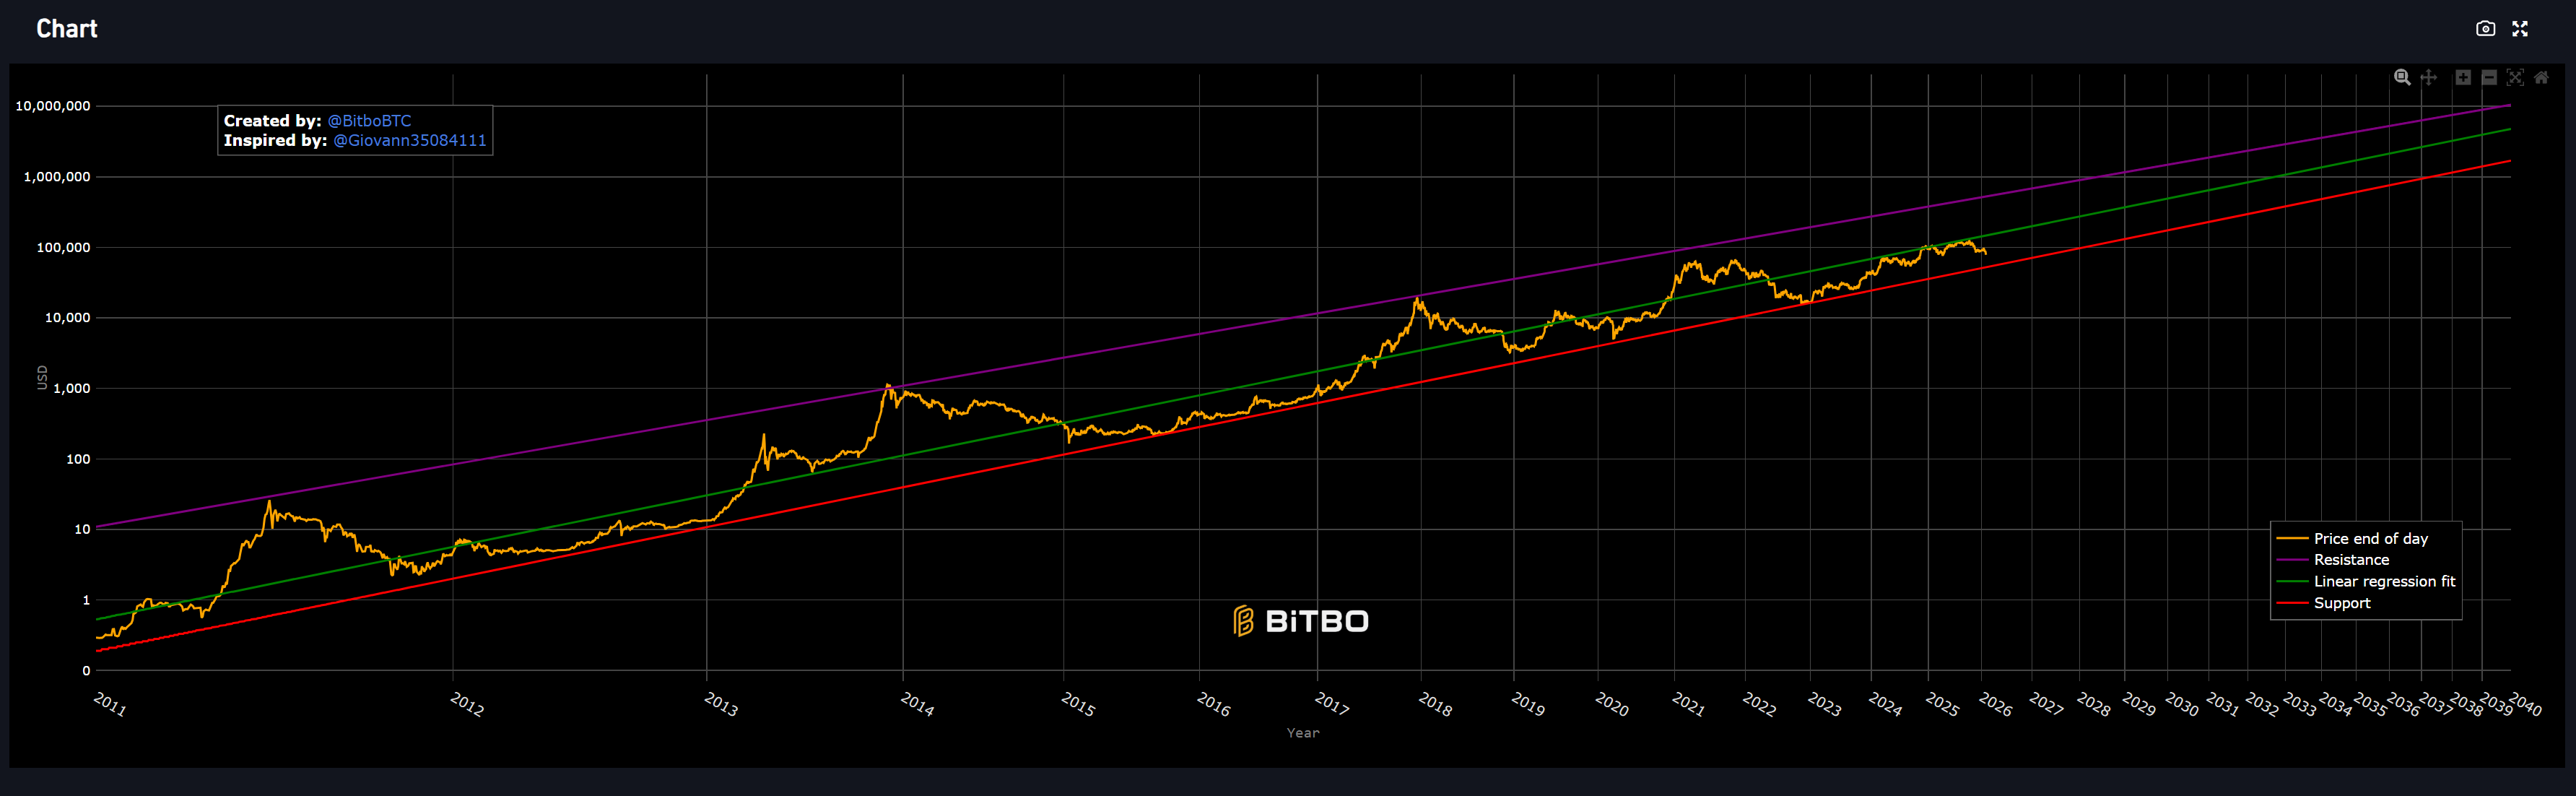
This second chart (backing chart) shows a logarithmic plot (10x increases). You can see predictable steps and you can also see the trajectory being more parabolic as it moves right. Vertical direction to the left flattening off to horizontal to the right.
An even more interesting chart I have embedded is the Relative Strength Index (RSI).
Looking at this you can see that RSI as a whole is trending lower highs and higher lows with time. The green checkmark bottom right would roughly suggest that area to target for blood-on-the-streets level timing.
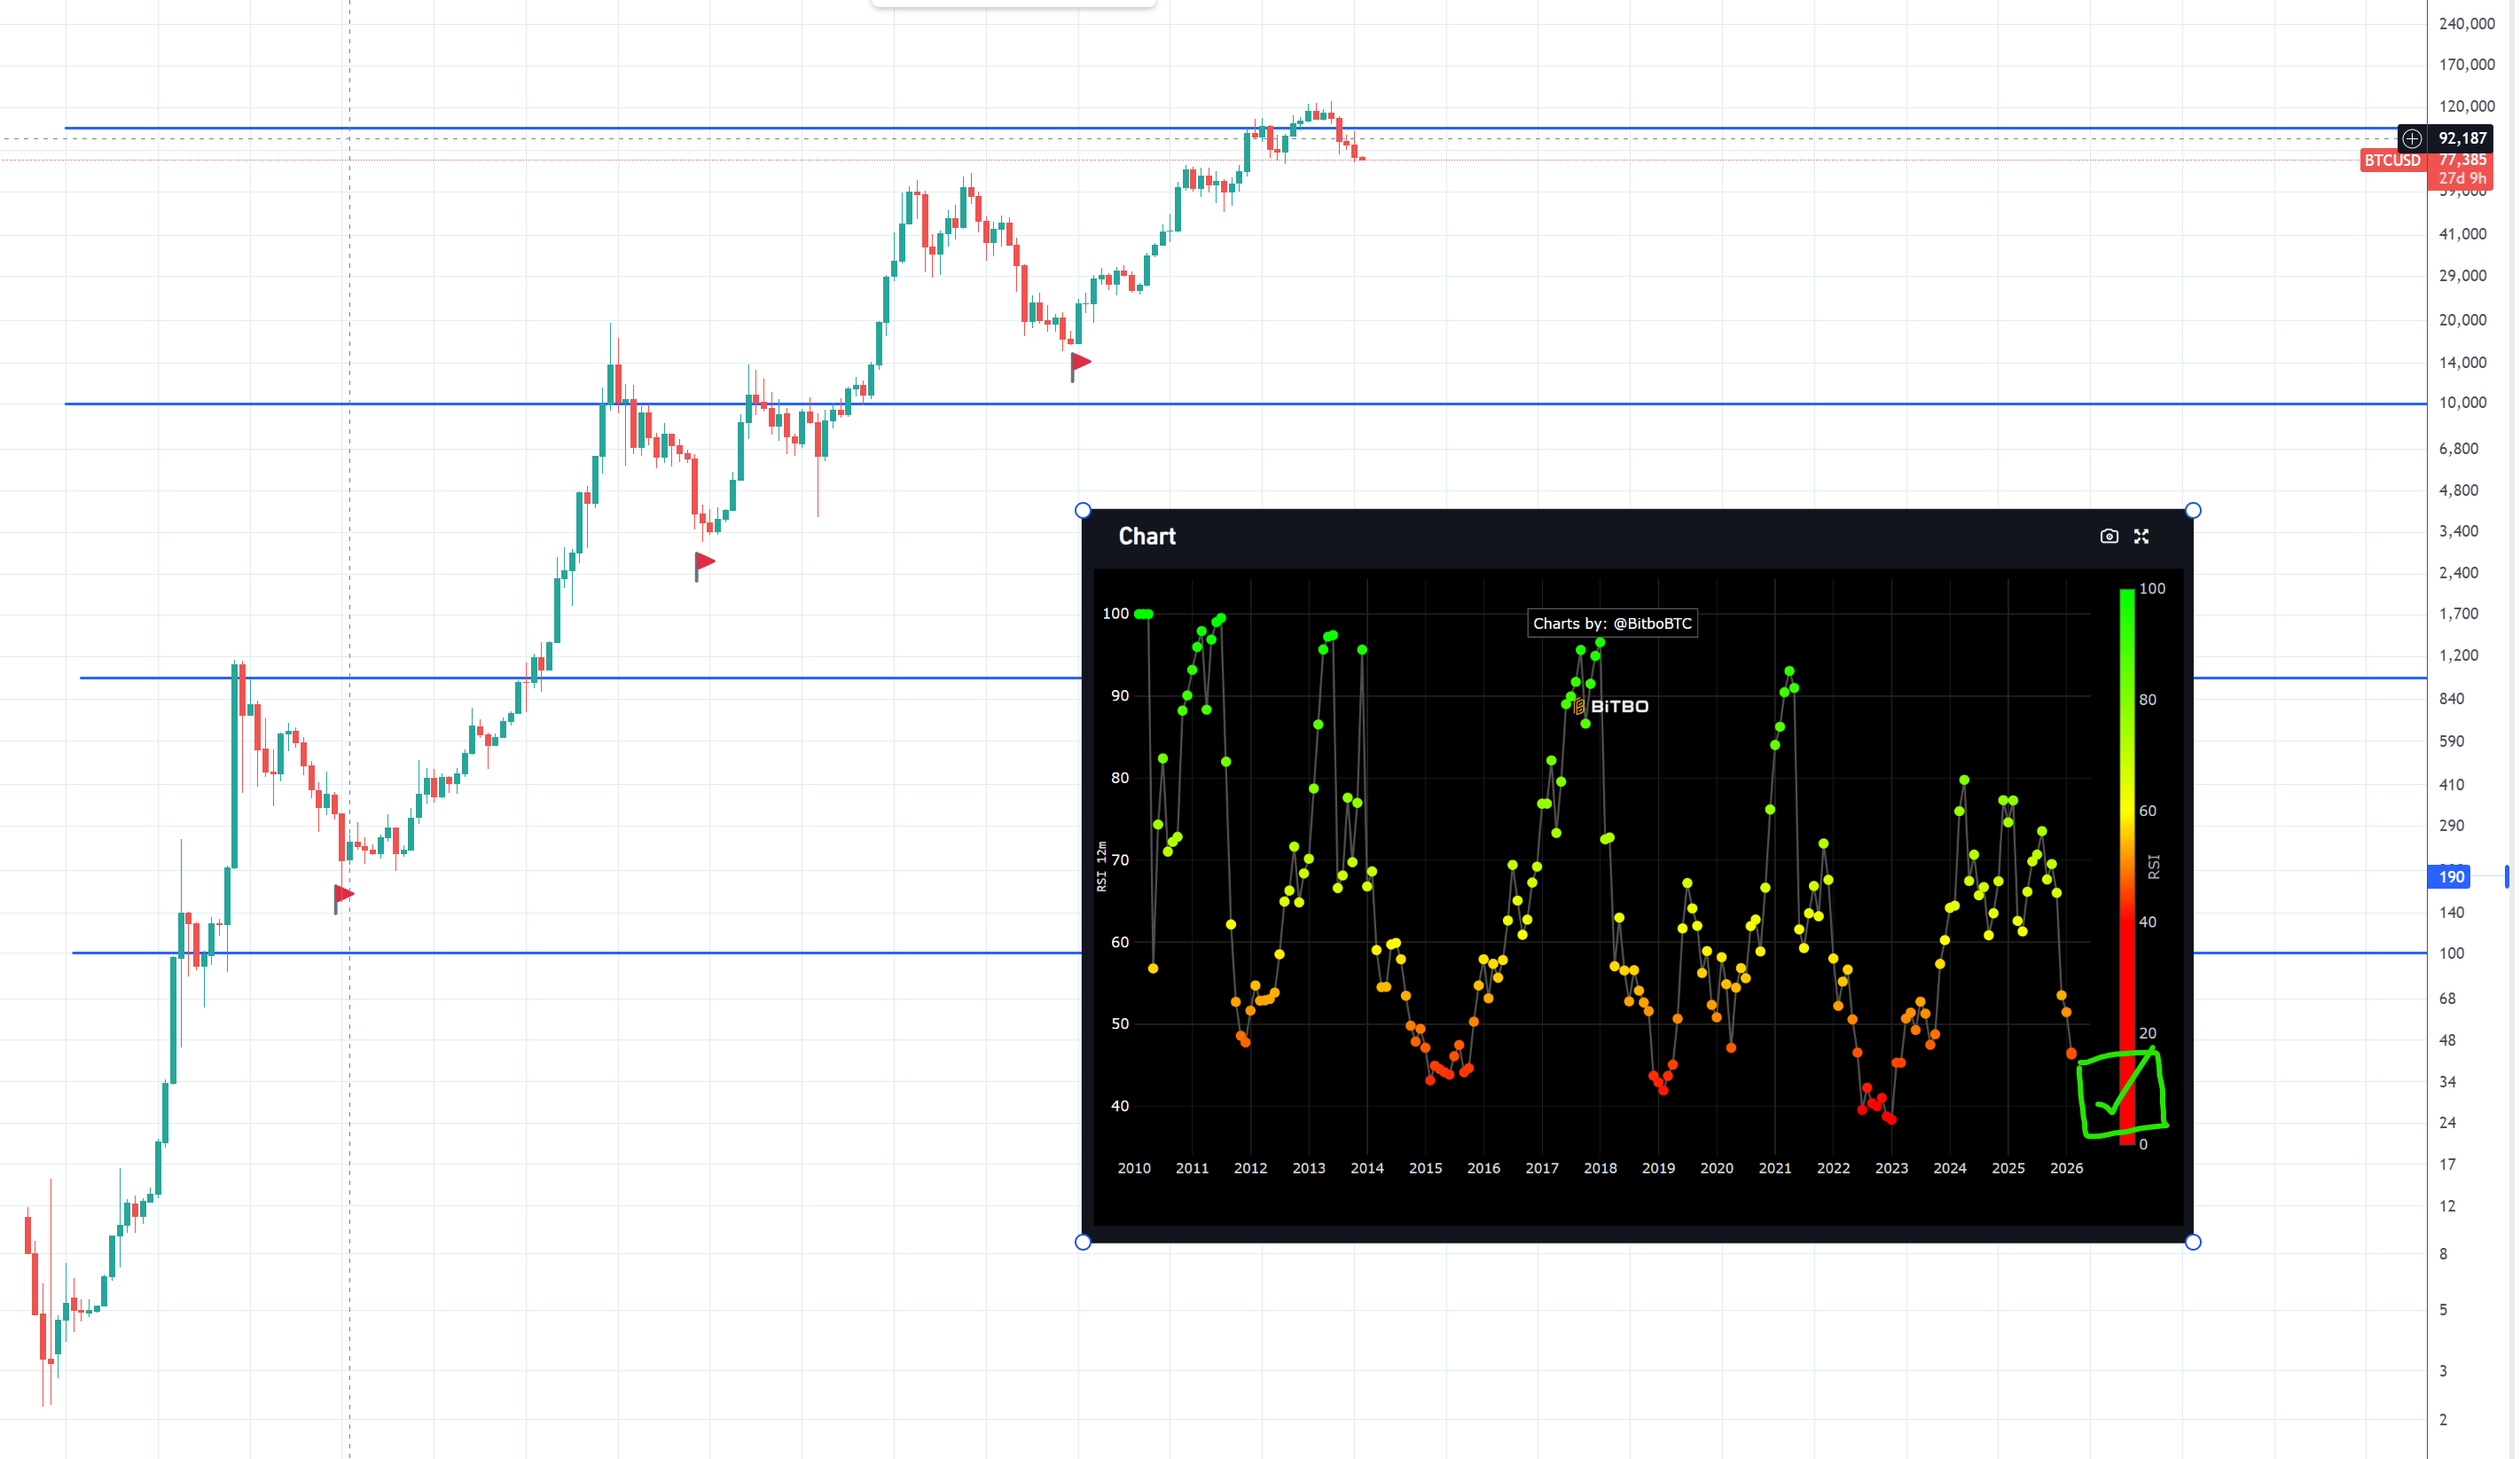
Chart here - https://charts.bitbo.io/monthly-rsi/
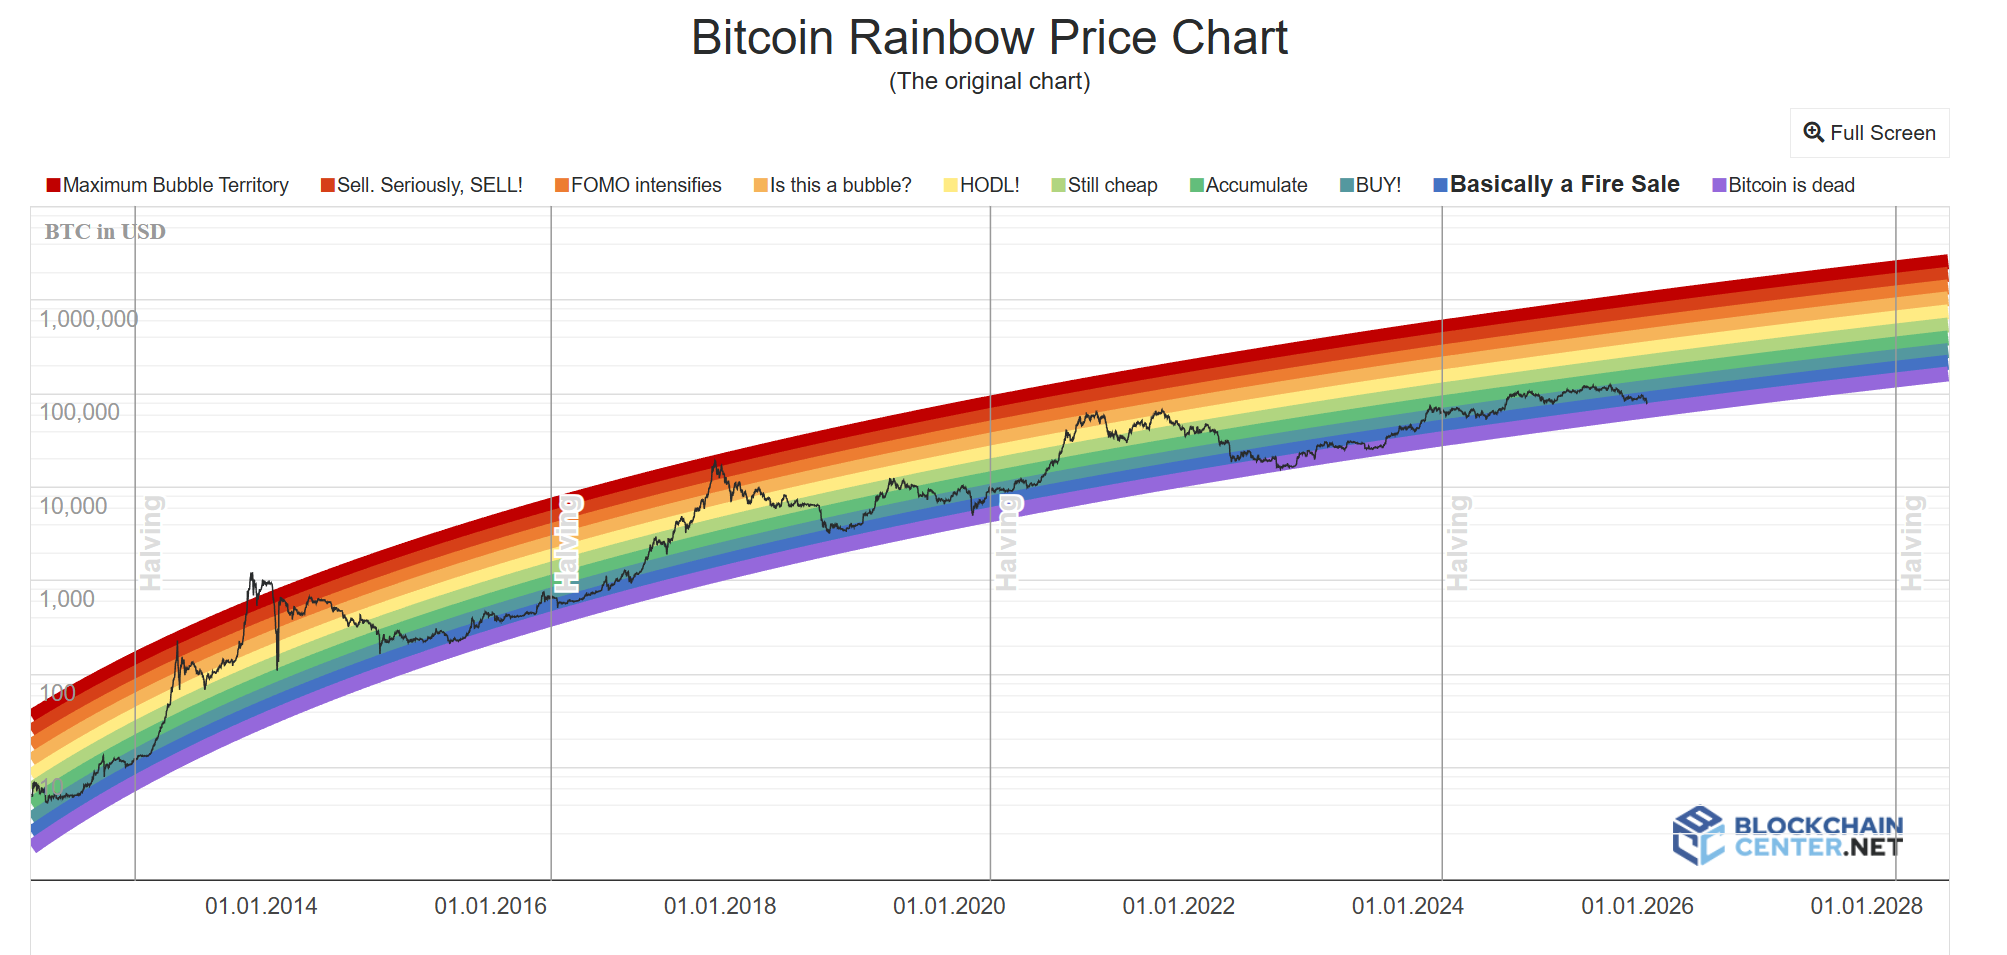
This next chart shows logarithmic support and resistance bands and the price. Helpful for seeing projected future price.
And this next one also gives similar information but with an action table associated with each price.
Conclusion
My take on it all is we’re early for a buying period for Bitcoin. Keep an eye on the RSI charts. I believe PlanB had updated his Stock To Flow variants to focus more on RSI recently. I believe that the multipliers on upsides get more and more muted with time. Gold and Silver have taken liquidity away from pure crypto plays in recent years.